. Analysis of a rhythm and determination of its characteristics.
. Detection of various rhythms in a serial set of data.
. Calculation of secondary periods from the basis period of a plurirhythmic phenomenon.
It allows a researcher to use the entire range of Cosinor methodology, and to perform different types of spectral analyses.
Analysis of time series and rhythms : Examples of methods with tools of Time Series Analysis Cosinor software
Since the start of work on chronobiological rhythms, there has been the hypothesis that a rhythmic phenomena is due to
synchronizers often considered to be exogenous (the classic example is light and darkness). However a synchroniser may also be endogenous
and thus intracellular, as a sort of "Pacemaker" as has been observed, for instance, in the motor activity of some protozoa.
The existence of a "Chronome" expressed at the level of the genome has even been proposed. Rhythms in living beings are present from the start of life.
Assorted methods, such as spectral analysis with or without a known period are used to study or reveal rhythms. The most well known among these is Cosinor.
Among the primary advantages of Cosinor are an insensitivity to noise in the data, and no requirement for data to be equally distributed in time.
Relative to spectral methods, particularly those derived from Fourier analysis, this makes Cosinor very interesting. This method can justify, or not,
the existence of a given rhythm and it can calculate its parameters (Amplitude, Phase or Acrophase and average level or MESOR)
TSA-Cosinor software, can also detect the rhythmic periods, study these periods, and define all characteristics (See figure 1-a.1, figure 1-a.2,
figures 1-c.1, 1-c.2, 1-c-3, 1-c.4) TSA-Cosinor also makes it possible to carry out the "Single Cosinor" test (See figure 1-a.2)
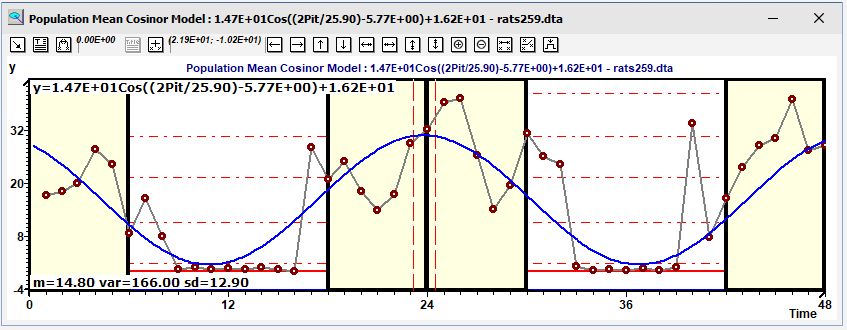
Figure 1-a.1 : Rats: Period of 25.9 hours (Period can also be 24 hours), confidence interval = 0.95 (α = 1 -p). Population Mean
Cosinor (according to Nelson et al, Bingham et al) and evaluation of related rhythm.
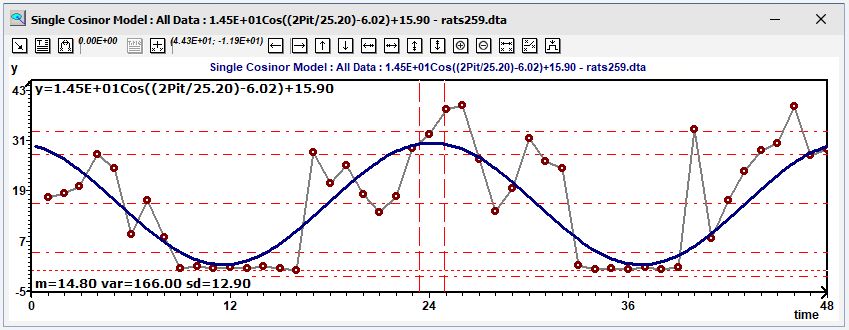
Figure 1-a.2 : Rats: Single Cosinor test according to Nelson et al, Bingham et al. Same study (Period can also be 24 hours)
confidence interval = 0.95 with α = 1-p. (Null amplitude test, ellipse test, analysis of residues, and so on)
TSA-Cosinor also provides a Cosinor for Population ("Population Mean Cosinor"). This brings together data from several subjects
in the form of a series and deduces an overall periodic model (vectorial average) and more from the models in each series.
It calculates the best sinusoidal model (via cosine function : harmonic regression) that can best pass through the
set of experimental points (See figure 1-b.1, figure 1-a.1)
Not only applicable to circadian rhythms (24 +/- 4 h), Cosinor makes it possible to model shorter and longer rhythms
(ultradian (<24h), dian (24 +/- 2h), infradian (>24h), and so on)
The software can also eliminate models of series of limited interest as well as the disadvantage of
falsified the results (via an appropriate test with the Population Mean Cosinor)
Figure 1-b.1 : Rats: Chronogram : Period of 25.9 hours. Model from the Population Mean Cosinor,
experimental points, average, variance and data standard deviation, confidence interval of the amplitude, confidence interval of the phase or acrophase
(Nelson et al, Bingham et al)
Figure 1-b.2 : Rats: Period of 25.2 hours. Single Cosinor Model showing experimental points, variance and
standard deviation, CI (95%) of phase or acrophase (according to Nelson et al, Bingham et al)
The classic Cosinor method is limited to mono-rhythmic model. The TSA-Cosinor surpasses this by introducing the technique of reinjection of residues to reveal whether there is plurirhythmic
activity (or not) and to calculate its parameters.
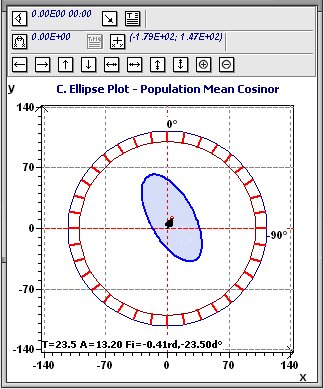
The geometrical representation of the various "Cosinor" tests is an ellipse that may cover the origin.
Primary periodic parameters are represented : the amplitude by a vector beginning at the origin and
ending to the center of the confidence ellipse and the phase by the angular position of the amplitude vector
on a graduated trigonometrical circle (see figure 1-c.1, 1-c.2, 1-c.3, 1-c.4)
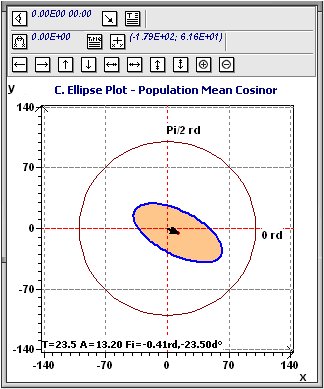
Figures 1-c.1, 1-c.2 : Rats: Confidence ellipse (Population Mean Cosinor) with confidence interval = 0.95 (α = 1-p = 0.05) according to Nelson et al, Bingham et al (clockwise, no rhythm for 25.3 hours period) and
Gouthière and Jacquin. The last representation (not clockwise) uses international units. Calculations are geometric.
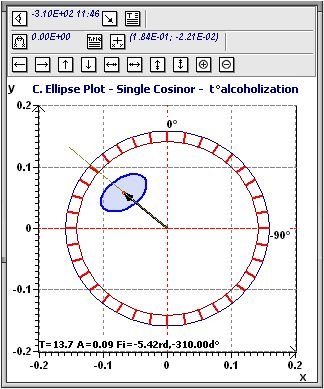
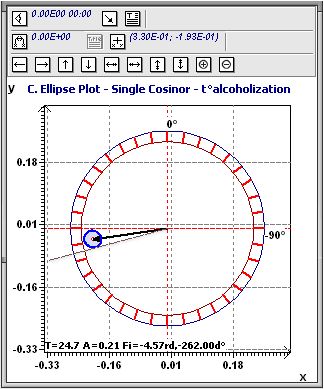
Figures 1-c.3, 1-c.4 : Temperature/Alcoholism (Cf Danel CHRU Lille, France): Confidence ellipse ("Single Cosinor")
with confidence limit probability of 0.95 (α = 1-p) according to Nelson et al, Bingham et al.
TSA-Cosinor software also allows Spectral Analysis including :
. Those relating to Cosinor modeling (Spectrum of "Percent Rhythm" figure 1-d.1, 1-d.2, Inverse Elliptic
figure 1-d.3) and not requiring equispaced time data.
. Those derived from Fourier analysis or related analysis (Spectrum of spectral densisty, Autospectral
figure 1-e.1, Autoperiodogram, Periodogram, Amplitude Discrete Fourier Transforms Figure 1-e.2) requiring equispaced
time data.
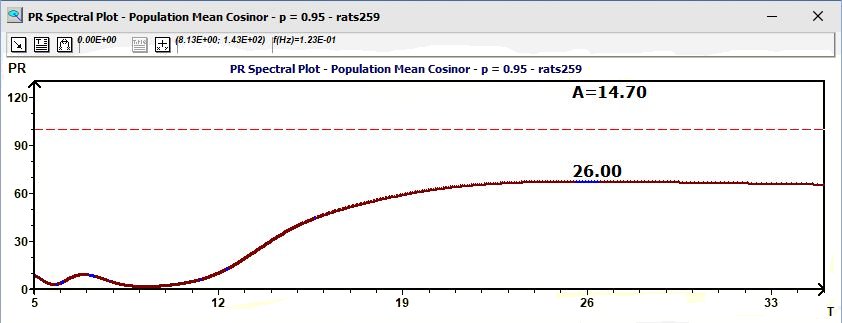
Figure 1-d.1 : Rats: Spectrum of Percent Rhythm according to the Population Mean
Cosinor. This allows detection of the period, interval of periods by the ellipse test (confidence interval in blue).
It is valid with a confidence limit of 0.95 (α = 1-p). (→ Frequencies spectrum)
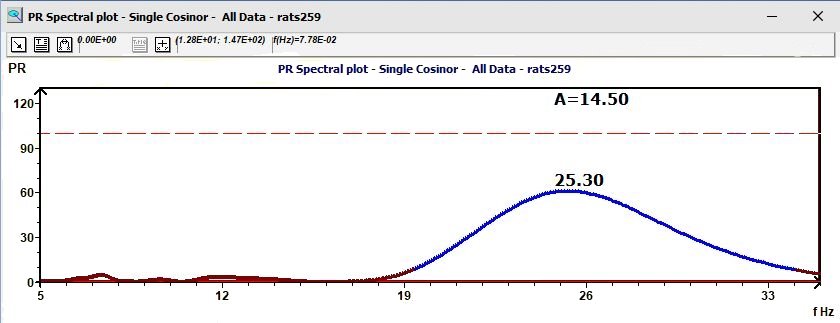
Figure 1-d.2 : Rats: Spectrum of Percent Rhythm according to the Single Cosinor. This
allows detection of period and, interval of periods (in blue) by the ellipse test and is valid with a confidence limit of 0.95 with
α = 0.05. (α = 1-p). (→ Frequencies spectrum)
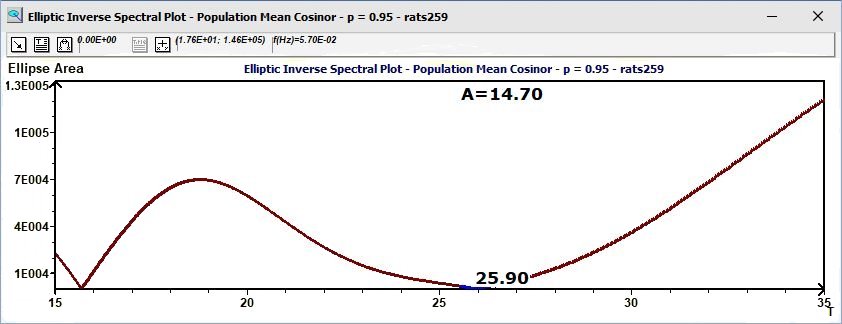
Figure 1-d.3 : Rats: Inverse Elliptic Spectrum from the Population Mean Cosinor according to Gouthière L. This allows detection of
periods by testing the surface of the ellipse, the interval of detected periods in blue (Confidence Interval), valid at the given confidence limit
probability p with α = 1-p.
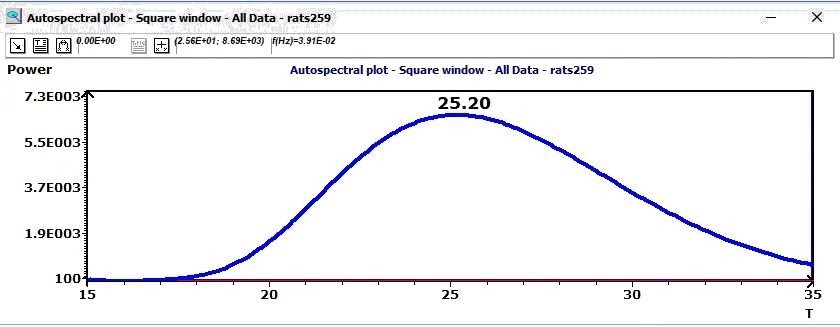
Figure 1-e.1 : Rats: Spectral analysis according to Jenkins and Watts, the main peak
corresponds to the detected period (and confirms the above methods). The disadvantage of this type of analysis is
that it requires equispaced time data. (→ Frequencies spectrum)
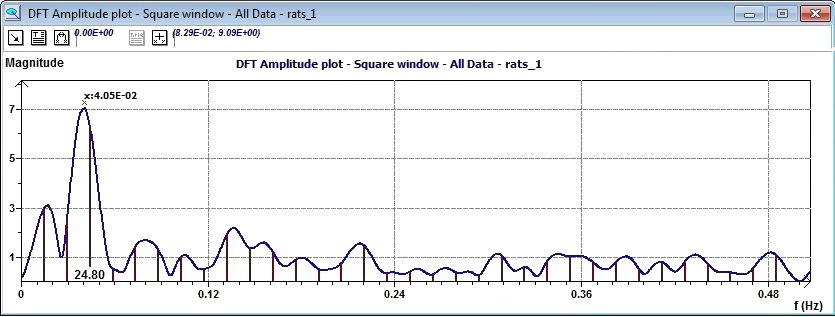
Figure 1-e.2 : Rats: Amplitude Discrete Fourier Transforms and line spectrum
showing the baseline of maximum amplitude (fundamental ray) of about 24 hours and the harmonics. (→ Periods spectrum)
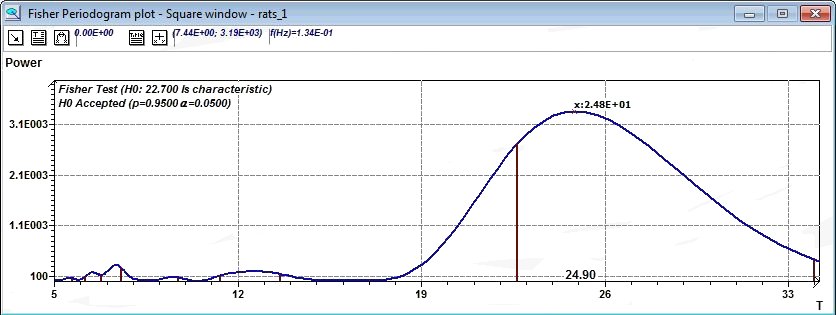
Figure 1-e.3 : Rats: The periodogram according to Fisher is a method derived from the DFT.
The baseline (fundamental ray) is tested to verify if it is characteristic of the periodic phenomenon being
studied at a given probability (α = 1-p).
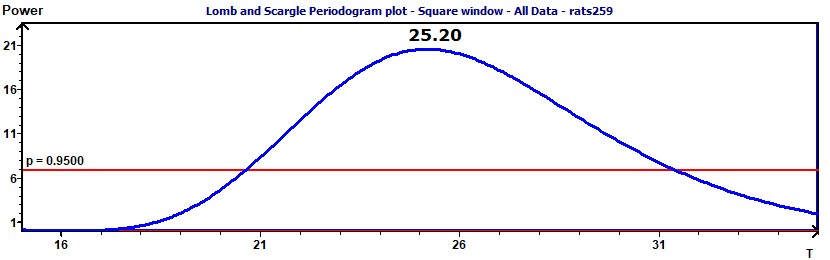
Figure 1-f.1 : Rats: Spectral periodogram according to Scargle, the main peak
corresponds to the detected period. The advantage is that this periodogram does not require equispaced time data
unlike the methods derived from Fourier transforms (and confirms the above methods) The level of probability : 0.95 with (α = 1-p) allows
checking the randomness of the signal (→ Frequencies spectrum)
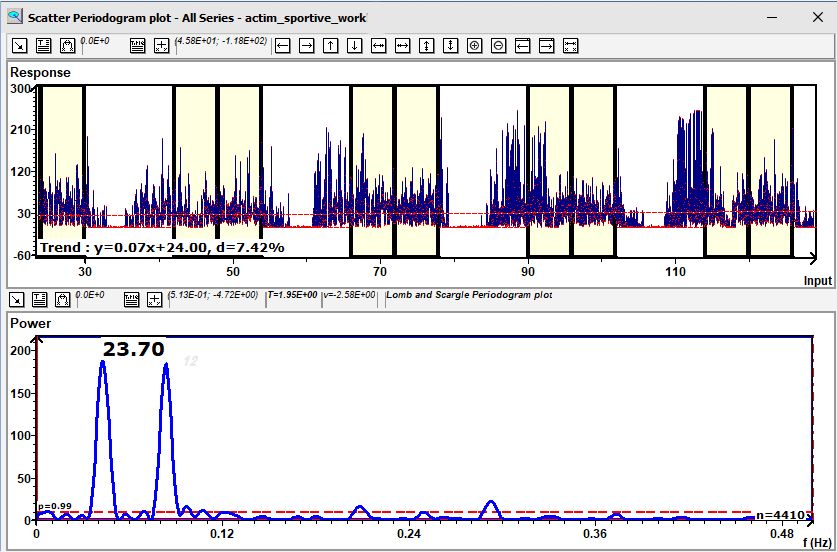
Figure 1-g.1 : Scatter periodogram : Sportive activity night shift work: The "Scatter periodogram" allows analysis of period variations and is adapted to the study of "jet lag" (Peugeot PSA)
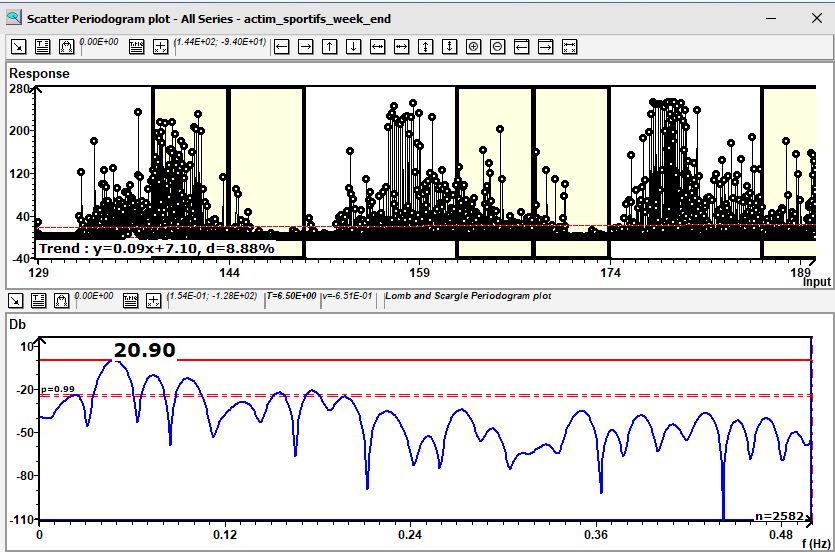
Figure 1-g.2 : Scatter periodogram : Sportive activity, night shift work, weekend rest: A shorter interval of time. You can choose different periodograms (Peugeot PSA)
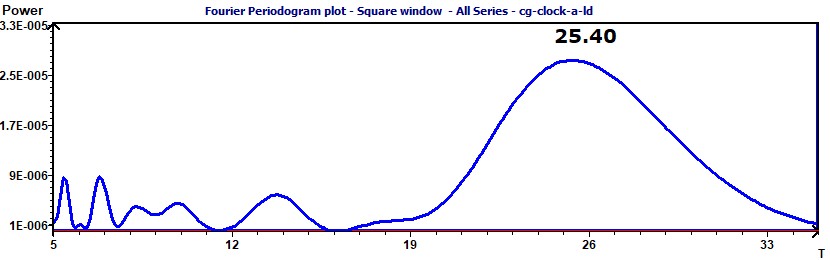
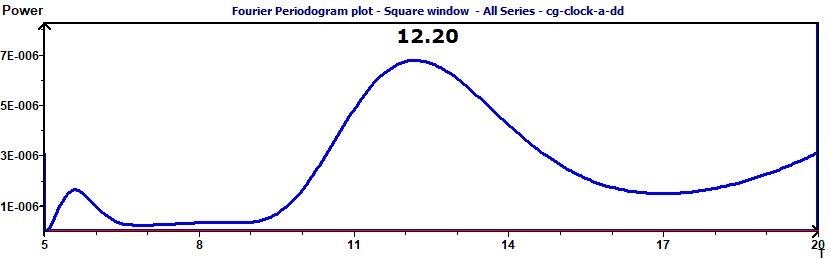
In the following example, the Cosinor analysis is not recommended (due to the lack of results). We will use the Fourier periodogram here.
Figure 1-h.1 : Fourier periodogram : Clock gene expression of bivalve mollusc (Crassostrea gigas) with lighting. We notice a period close to 24 hours (EPOC CNRS)
Figure 1-h.2 : Fourier periodogram : Clock gene expression of bivalve mollusc (Crassostrea gigas) without lighting. We notice a period close to 12 hours (EPOC CNRS)
Other study tools are provided such as the Autocorrelation graphic, the "Normal" probability diagram, the Lag diagram (Lag plot), the Scatter plot,
the Run sequence plot, the Box plot, and so on These graphic tools from "Exploratory Data Analysis" (EDA) allows study of time series independently
of the data origin.
This complete set of study and treatment possibilities is a major point of interest of TSA-Cosinor software for any study in Rhythmometry, Chronobiology,
Chronoeconometry or of Periodic phenomena.
Fields of applications
The TSA-Cosinor applies to assorted fields that study rhythmic phenomena :
. General Chronobiology.
. Chronopharmacology and Chronotherapy to investigate the time to administer a medicinal molecule or a treatment.
. Chronopsychological sociology to allow definition of profiles.
. Chronoeconomy or Chronoeconometry to forecast cyclical variation of economic factors.