The scientific software for the rhythms analysis, time series analysis and forecasting.
It combines the
Exploratory Data Analysis approach (Tukey) applied to the graphical analysis of data in rhythmic phenomena and time series:
Scatter plot, run sequence plot, lag plot, autocorrelation plot, Normality plot with
powerful numerical statistical tests (K-S test, Q test, KW test, and so on.)
This version allows researchers to use the entire range of
"Cosinor" methodology,
Cosinor analysis (Nelson, Bingham, Halberg) and the most complete (Confidence ellipses, modelisation, chronograms, polargrams, study of residuals, complete calculation of
chronobiological,
chronobiometrical or
chronoeconometric parameters)
It also provides the most
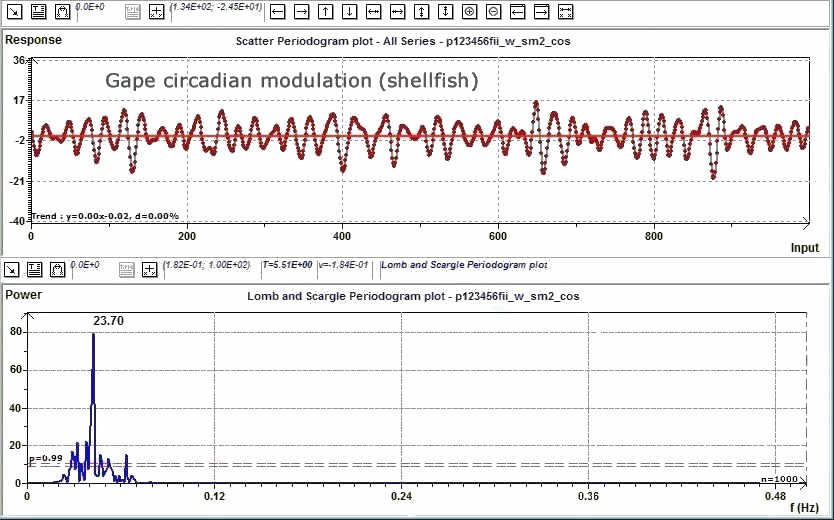
powerful different spectral analysis and periodograms :Jenkins and Watts, Lomb and Scargle (Scargle), Schwarzenberg-Cerny, Fourier, Burg MESA, Halberg, Gouthière : Reverse Elliptic, "Percent rhythm" to
find periods.Features are offered such as :
Complex demodulations plots, transformation of previous data (log, arcsin and so on), removing linear or polynomial trend, filters, variance homogeneity plot of residuals, the graphs of Normality of residuals and so on.


 Chronobiology : Principles and methods by Pietro Cugini.
 How to define a rhythm using a scientific methodology by Jean de Prins.
 Cosinor-based rhythmometry by Germaine Cornélissen.
 Complementary methodology in the analysis of rhythmic data... by Laurent Gouthière, Benoit Mauvieux et al.